

Gameweek 3 is a crucial period where the early-season noise begins to dissipate, and the true signal of underlying performance starts to emerge. While many managers might react to surface-level points, our models cut through the immediate results to reveal what is truly happening beneath.
Our intelligence mission was clear: to audit player performance from the opening three gameweeks, identifying those whose scores were influenced by luck versus those with strong underlying metrics.
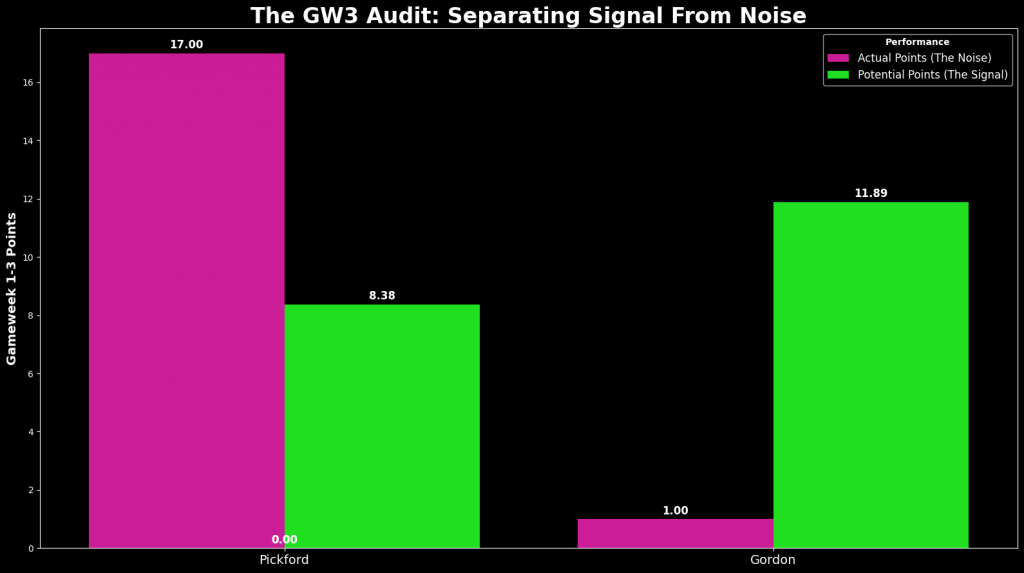
This chart visualizes performance from Gameweeks 1-3. The magenta bar represents Actual Points (The Noise)—the raw, often misleading, score they delivered. The vibrant green bar represents Potential Points (The Signal)—our model’s true prediction of their underlying performance. The divergence between these two figures highlights key insights.
The Over-Performers: Where Actual Points Exceeded Potential (Potential Sells)
These are the players whose actual points significantly and surprisingly outstripped their underlying data in the opening three gameweeks.
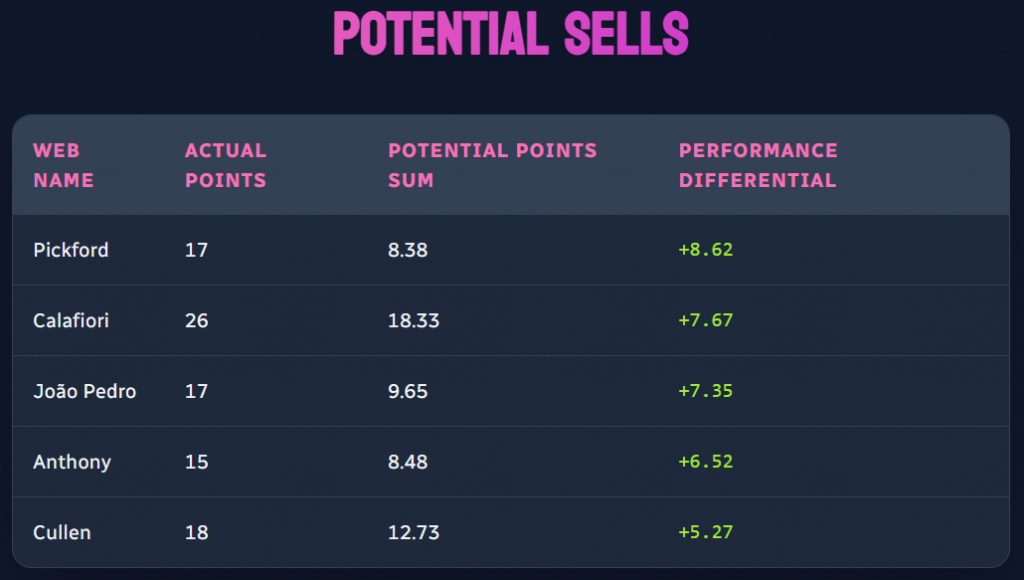
For Pickford, his 17 actual points significantly outstripped his 8.38 Potential Points, a difference of +8.62. While this performance is notable, such overperformance, especially over a small sample size like three gameweeks, means it is statistically unlikely to be sustained. Our models suggest a high likelihood of regression towards his underlying potential in upcoming gameweeks. Managers should consider if these assets can continue to defy their underlying metrics.
The Under-Performers: Where Potential Outshone Actual (Prime Targets)
This list highlights players who, despite low actual returns, demonstrated strong underlying performance metrics. Their process was sound; the points are simply delayed.
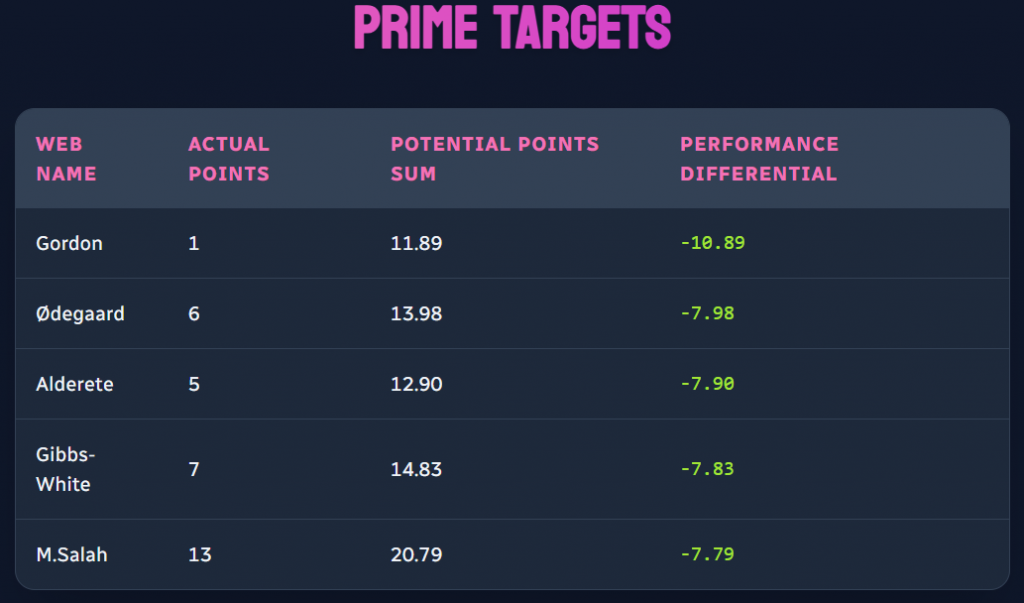
Consider Gordon. Despite scoring only 1 actual point, his underlying Potential Points sum for GW1-3 was a strong 11.89, indicating a significant -10.89 underperformance. Historically, and informed by our models, players with strong underlying metrics who have underperformed are statistically due for positive regression. These are the players poised to convert their strong process into points soon, making them intelligent transfer targets before the market reacts.
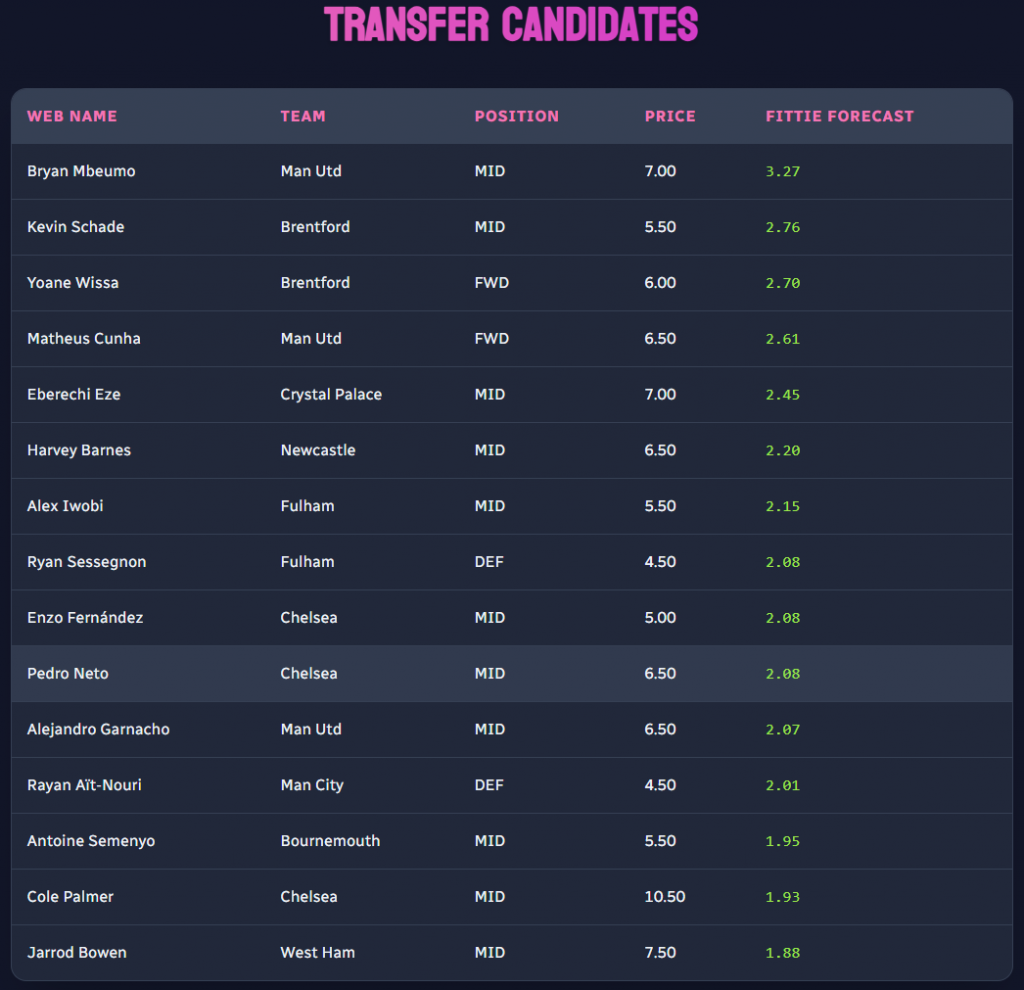
The Fittie Forecast for GW4: Your Tactical Edge
Now that we’ve audited the past, it’s time to arm you for the future. The Fittie Forecast is the refined output of our most accurate pure prediction engine. This is not a measure of value or momentum; it’s the definitive answer to the question: “Who will score the most points this week?”
Here are the top candidates for Gameweek 4, according to our models:
The Trap Door Candidate for GW4: A High-Risk Warning
Even with advanced metrics, some players represent significant risks. Our models identify the most prominent traps.
- The Trap: Enzo Fernández (MID, £5.0m)
- Justification: While his price is appealing, Fernández carries a critical yellow “!” flag in the game, indicating a fitness doubt—a major red flag for immediate investment. Our Fittie Forecast for GW4 projects a low 2.08 points. Given his immediate injury risk and modest short-term projection, investing in Fernández now represents a high-risk move with limited expected short-term returns.
A Note on Strategic Holds: The Cole Palmer Paradox
You might notice Cole Palmer (£10.5m) also appears on our Fittie Forecast list with a low GW4 projection of 1.93 points and a fitness flag. This is a player currently in our team, and while the short-term outlook presents risks, our decision to hold him is a deliberate, data-backed long-term play.
- Why the Hold: Palmer, as a premium asset, holds significant team value. Selling him now at a potential loss, only to potentially buy him back at a higher price later, is often suboptimal. Our long-term models indicate that despite immediate challenges, his integral role in the Chelsea setup and a favorable upcoming fixture swing after GW4 are expected to see him return to form. This is a strategic patience play, backing our deeper long-term predictions against short-term noise. For managers without this long-term outlook or higher risk tolerance, the warning flags are valid.
The Final Word
The opening gameweeks are a mix of data and noise. Our audit provides clarity. By understanding which players are due for regression and which are due for positive conversion, you can make intelligent, data-driven transfer decisions that set you apart from the herd. Arm yourself with this intelligence to secure your green arrows.
Leave a Reply